
Built Using Microsoft Power BI
Click on any of the sample dashboards below to view the interactive versions. These samples are best viewed on a desktop computer. However, there is a double-sided arrow at the bottom right of each dashboard. Tap that arrow to get a better view on mobile, or click to enter full-screen mode on desktop.
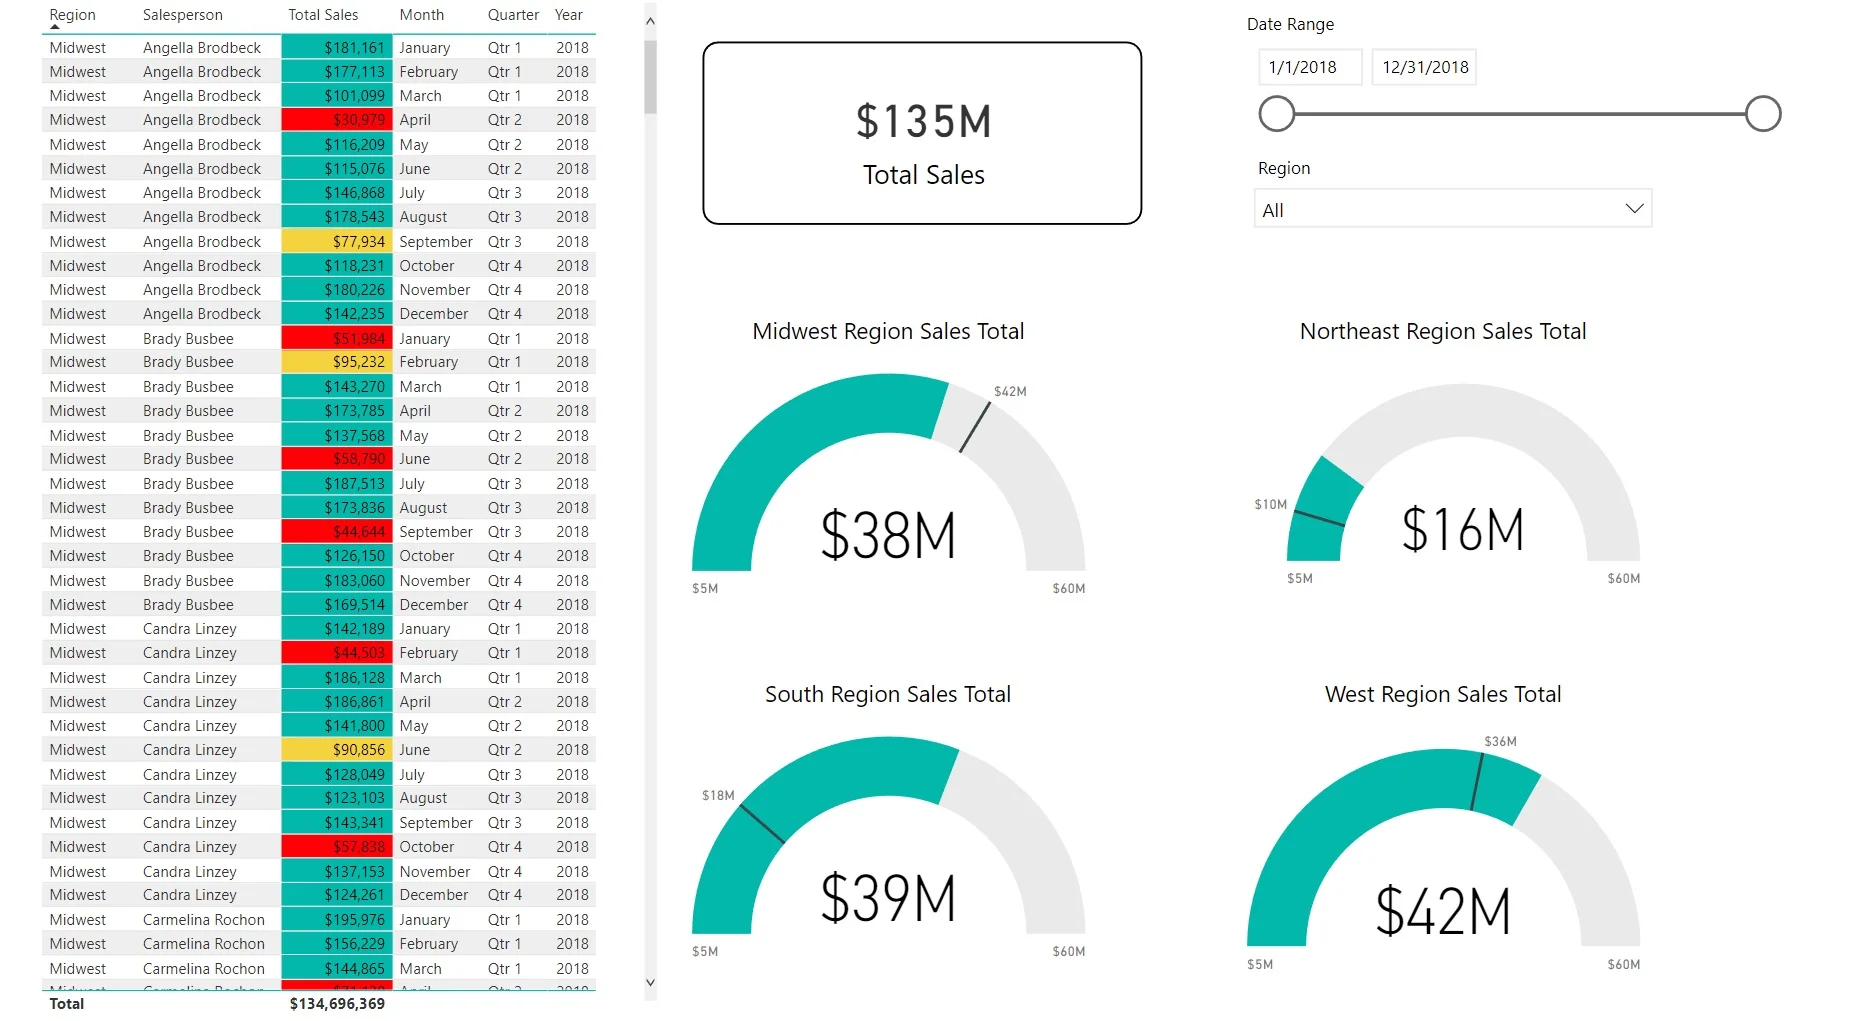
Company Sales Performance
This dashboard is designed to track performance of individual salespeople as well as regions or divisions of a company.
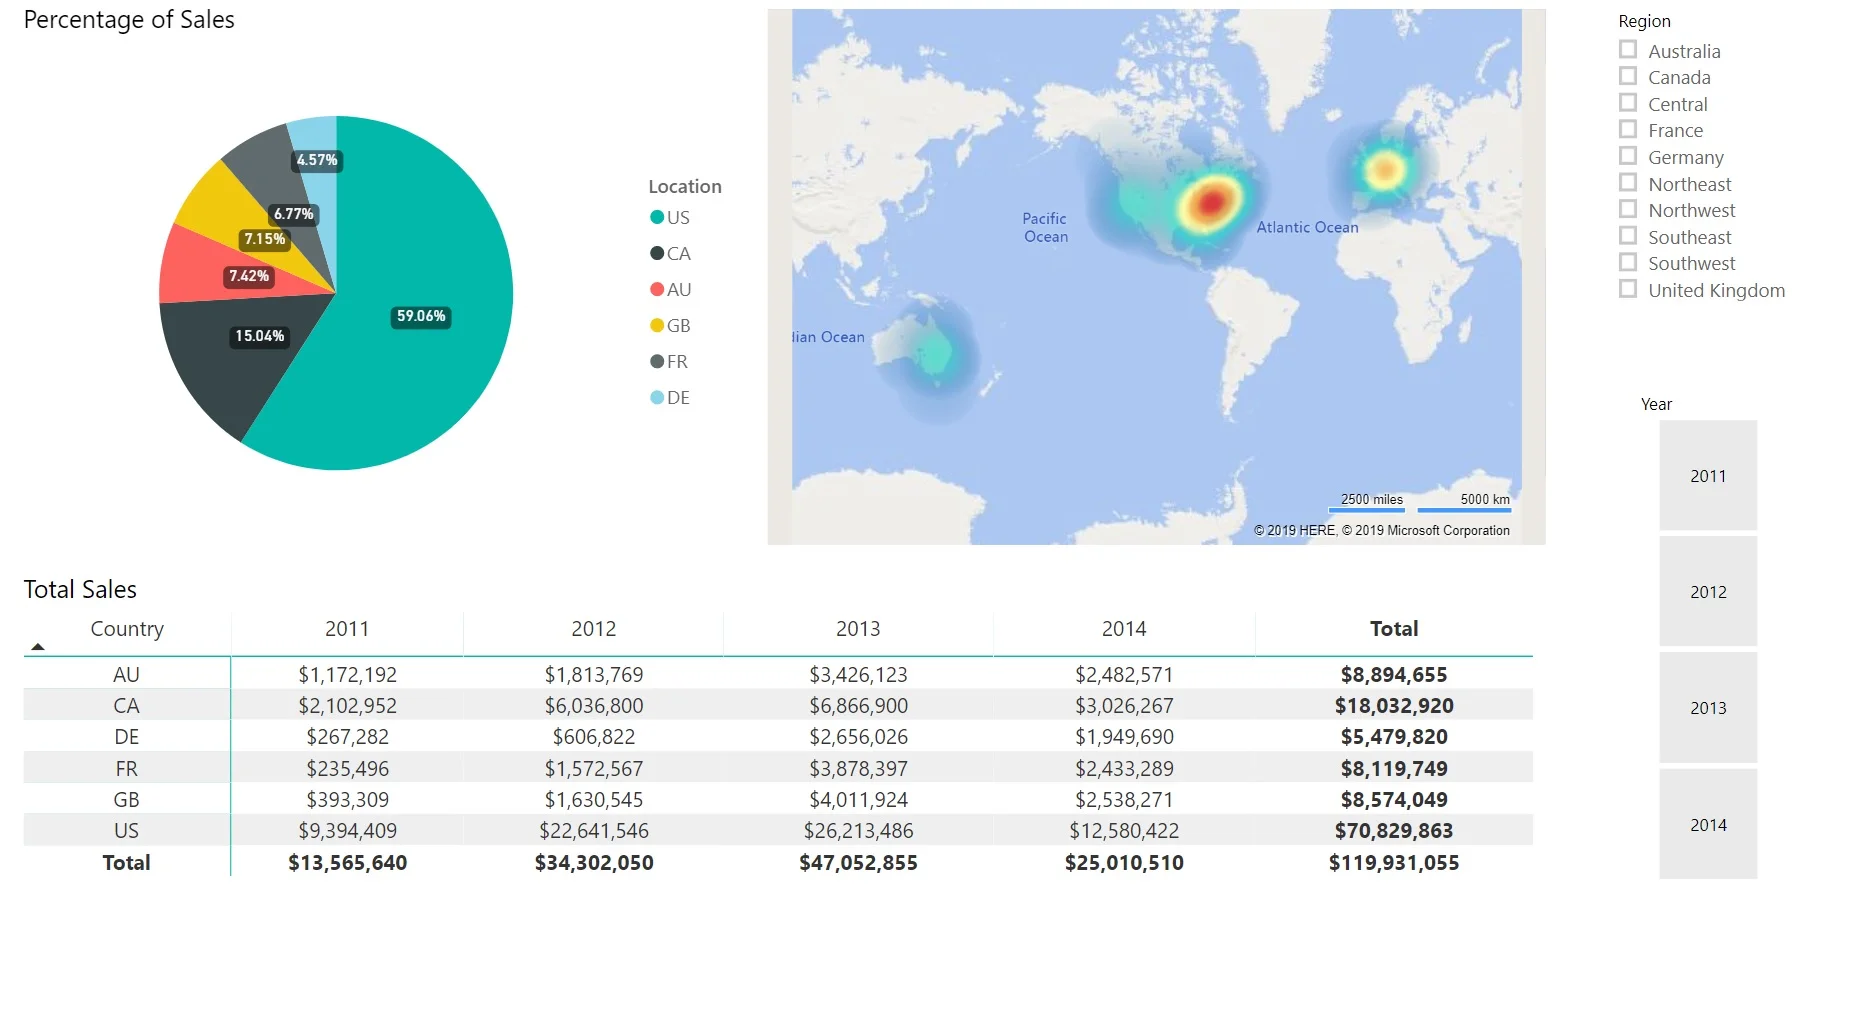
Sales Heat Map
See how Power BI can be used to drill down to the lowest level of detail and interact real-time with a map.
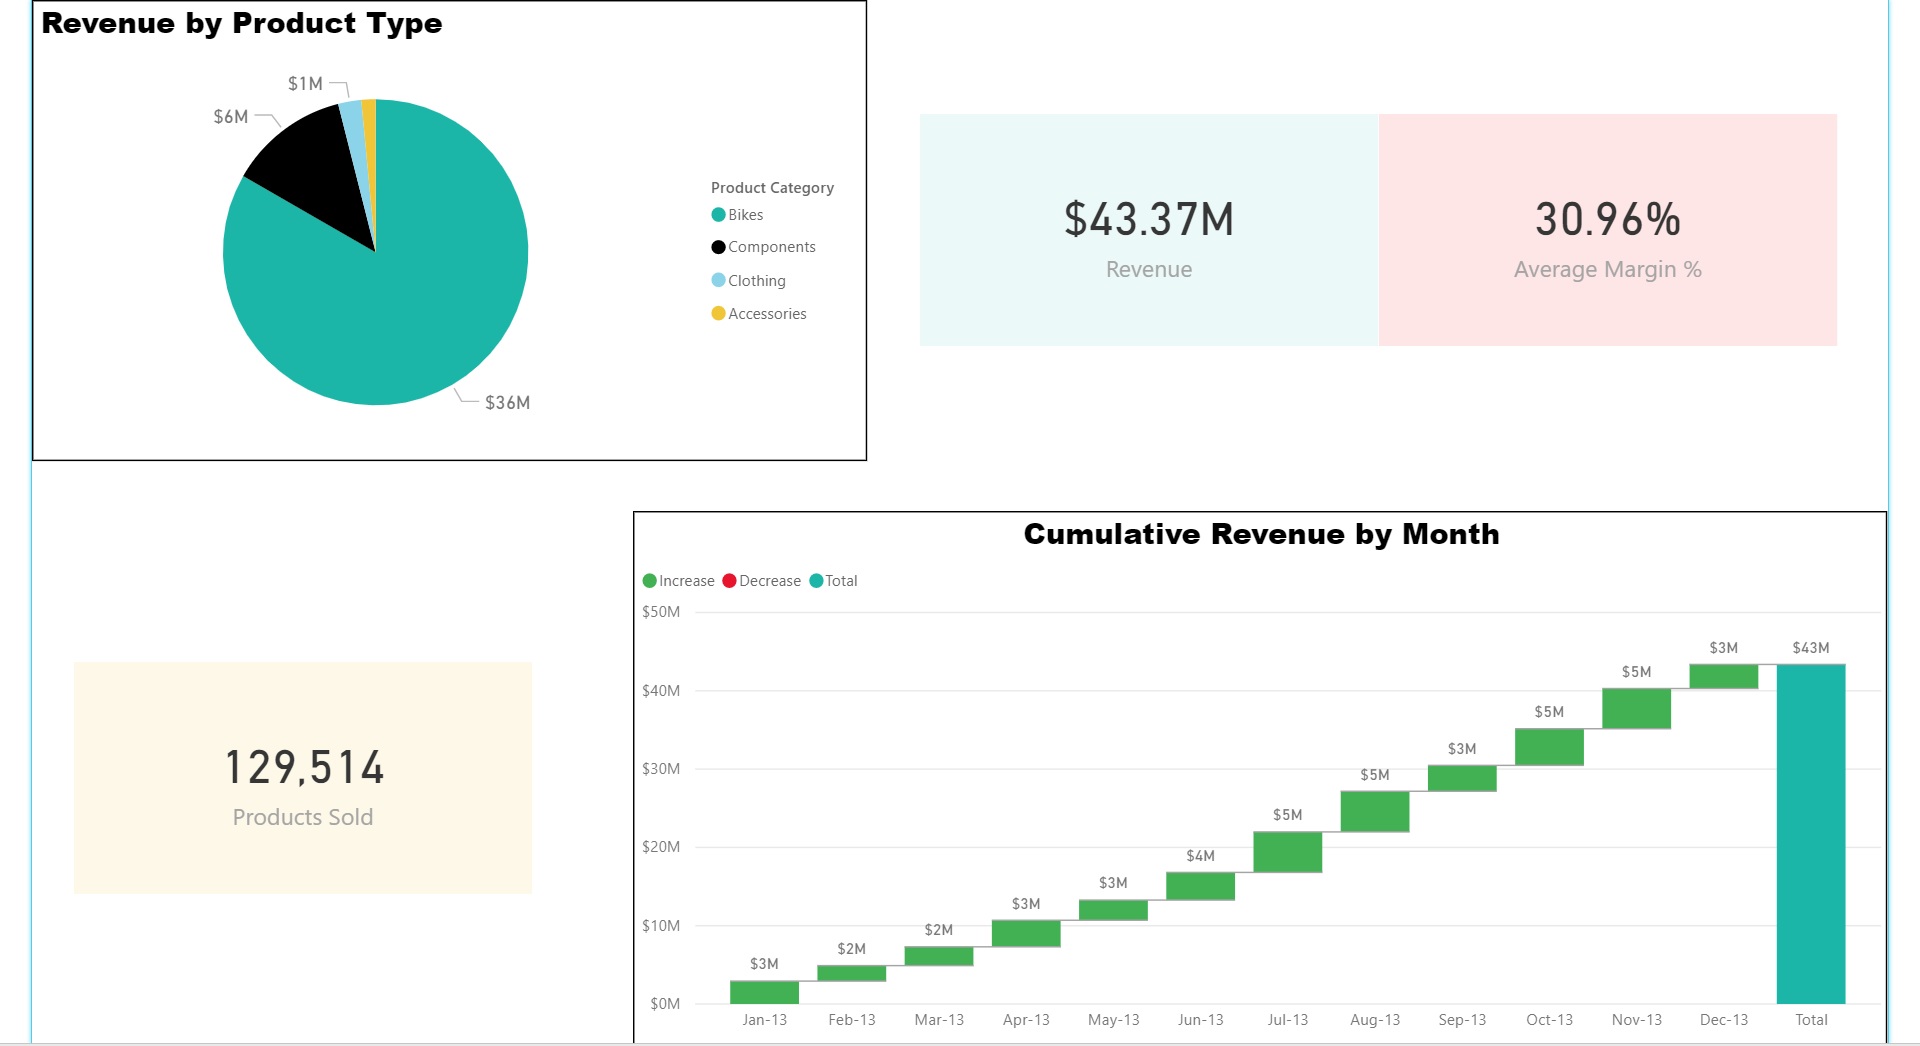
Product Sales Performance
See performance of product categories as well as hundreds of individual products in one straightforward dashboard for a bike store.
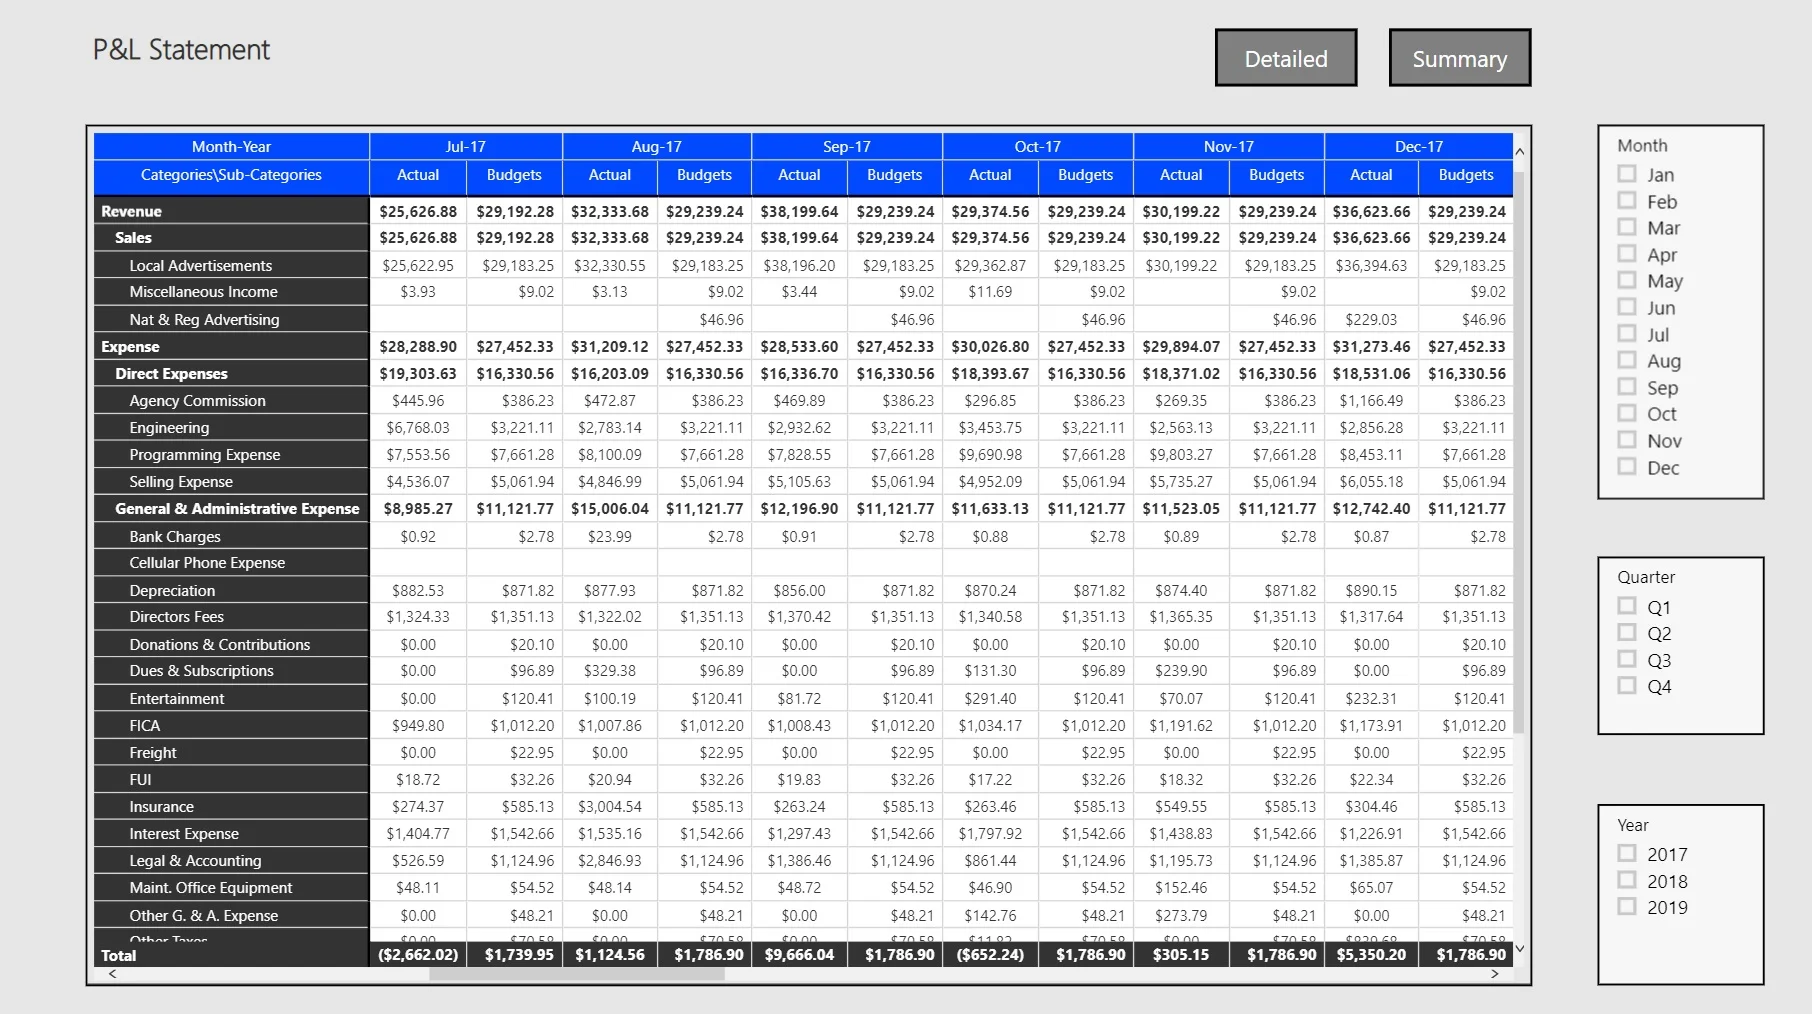
Finance Visual
See how an entire financial statement can be visualized and analyzed in Power BI.